WELCOME TO THE UNITED STATES OF AMERICA (USA): PAST, PRESENT, AND FUTURE
A Celebration of Contemporary Democracy in Action - USA Presidential Election Day
2020 USA Presidential Election Redux: And The Winner Is…
The election prognosticators are called upon each election cycle to predict the outcome of the USA Presidential election. The 2020 USA Presidential election cycle was no exception. Perhaps two of the most well-known and influential USA Presidential election prognosticators are American University professor Allan Lichtman and Stony Brook University professor Helmut Norpoth. Allan Lichtman predicted a Joe Biden victory. Helmut Norpoth predicted a Donald Trump victory. As fate would have it, Joe Biden prevailed in the 2020 USA Presidential election. Thus, Allan Lichtman remains undefeated in his predictions, and he retains his belt as the undisputed USA Presidential election prophesying champion of the world.
AMERICA'S PAST
- USA History
- The Presidents
- Historical Growth of USA Cities
- Historical USA Population Growth
- The Century, America's Time
AMERICA'S PRESENT
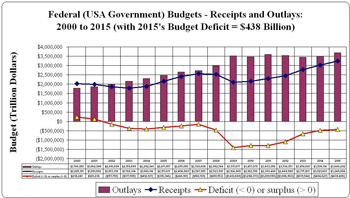
1 of 7. Present-Day USA Public (Government) Sector Operations: Federal Deficit History Since 2000
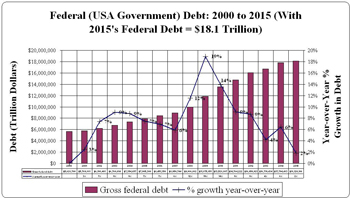
2 of 7. Present-Day USA Public (Government) Sector Operations: Federal Debt History Since 2000
| Debt Held by the Public | Amount (in Billions) | Percent Public Debt |
|---|---|---|
| DEBT HELD BY THE PUBLIC AS PRIVATE INVESTMENTS | ||
| Treasury bills marketable securties held by public investors | 1,355,231 | 10.33% |
| Treasury notes marketable securties held by public investors | 8,366,026 | 63.75% |
| Treasury bonds marketable securties held by public investors | 1,688,208 | 12.86% |
| Treasury inflation-protected securities (TIPS) marketable securties held by public investors | 1,135,363 | 8.65% |
| Treasury floating rate notes (FRN) marketable securties held by public investors | 287,039 | 2.19% |
| Domestic Series nonmarketable securities held by public investors | 29,995 | 0.23% |
| Foreign Series Nonmarketable securities held by public investors | 264 | 0.00% |
| State and Local Government Series Nonmarketable securities held by public investors | 78,115 | 0.60% |
| United States Savings Securities nonmarketable securities held by public investors | 172,826 | 1.32% |
| Government Account Series Nonmarketable securities held by public investors | 9,138 | 0.07% |
| Other Nonmarketable securities held by public investors | 1,642 | 0.01% |
| Total Treasury securities (public) | 13,123,847 | 100.00% |
| INTRAGOVERNMENTAL DEBT HOLDINGS | ||
| Debt Held by Federal Government Accounts | Amount | Percent Intragovernmental Debt |
| Social Security Administration, Federal Old-Age and Survivors Insurance Trust Fund | 2,766,649 | 55.18% |
| Office of Personnel Management, Civil Service Retirement and Disability Fund | 718,952 | 14.34% |
| Department of Defense, Military Retirement Fund | 530,960 | 10.59% |
| Department of Defense, Medicare-Eligible Retiree Health Care Fund | 205,793 | 4.10% |
| Department of Health and Human Services, Federal Hospital Insurance Fund | 195,458 | 3.90% |
| Department of Health and Human Services, Federal Supplementary Medical Insurance Trust Fund | 66,128 | 1.32% |
| Federal Deposit Insurance Corporation, The Deposit Insurance Fund | 60,096 | 1.20% |
| Department of Energy, Nuclear Waste Disposal Fund | 51,812 | 1.03% |
| Office of Personnel Management, Postal Service Retiree Health Benefits Fund | 45,237 | 0.90% |
| Department of Labor, Unemployment Trust Fund | 44,368 | 0.88% |
| Office of Personnel Management, Employees Life Insurance Fund | 43,958 | 0.88% |
| Social Security Administration, Federal Disability Insurance Trust Fund | 41,638 | 0.83% |
| Office of Personnel Management, Employees Health Benefits Fund | 23,018 | 0.46% |
| Department of the Treasury, Exchange Stabilization Fund | 20,773 | 0.41% |
| Pension Benefit Guaranty Corporation Fund | 18,492 | 0.37% |
| Department of State, Foreign Service Retirement and Disability Fund | 18,144 | 0.36% |
| Department of Housing and Urban Development, FHA, Mutual Mortgage Insurance Capital Reserve Account | 14,733 | 0.29% |
| Department of Housing and Urban Development, Guarantees of Mortgage-Backed Securities Capital Reserve Account | 12,772 | 0.25% |
| Department of Transportation, Airport and Airway Trust Fund | 12,716 | 0.25% |
| National Credit Union Share Insurance Fund | 11,584 | 0.23% |
| All other programs and funds | 110,680 | 2.21% |
| Total intragovernmental debt holdings | 5,013,961 | 100.00% |
| GRAND TOTAL FEDERAL DEBT OUTSTANDING AS OF 2015 | 18,137,808 | |
Source:
Note 11. Federal Debt Securities

Note: There is a slight and insignificant difference in the USA debt totals shown in the above table when compared to the totals depicted in the above debt chart. The difference between the two totals is attributable to the use of different data sources. Both sources conclude with a 2015 USA debt of $18.1 trillion.
| Country | Amount Held as of Dec 2015 (in Billions) | Percent |
|---|---|---|
| China, Mainland | $1,246.1 | 20.27% |
| Japan | $1,122.6 | 18.26% |
| Ireland | $265.1 | 4.31% |
| Brazil | $254.8 | 4.14% |
| Cayman Islands | $248.4 | 4.04% |
| Switzerland | $231.9 | 3.77% |
| United Kingdom | $207.2 | 3.37% |
| Luxembourg | $200.5 | 3.26% |
| Hong Kong | $200.2 | 3.26% |
| Taiwan | $178.7 | 2.91% |
| Belgium | $121.7 | 1.98% |
| Saudi Arabia | $119.1 | 1.94% |
| India | $116.8 | 1.90% |
| Singapore | $110.3 | 1.79% |
| Russia | $92.1 | 1.50% |
| Germany | $74.7 | 1.22% |
| Korea, South | $74.6 | 1.21% |
| Canada | $72.4 | 1.18% |
| Mexico | $72.2 | 1.17% |
| United Arab Emirates | $69.5 | 1.13% |
| Norway | $69.1 | 1.12% |
| Turkey | $64.6 | 1.05% |
| France | $61.6 | 1.00% |
| Bermuda | $59.8 | 0.97% |
| Netherlands | $49.2 | 0.80% |
| Philippines | $43.0 | 0.70% |
| Sweden | $39.4 | 0.64% |
| Thailand | $39.1 | 0.64% |
| Colombia | $37.0 | 0.60% |
| Spain | $36.2 | 0.59% |
| Italy | $34.6 | 0.56% |
| Kuwait | $31.7 | 0.52% |
| Australia | $30.6 | 0.50% |
| Poland | $30.2 | 0.49% |
| Chile | $27.3 | 0.44% |
| Kazakhstan | $22.6 | 0.37% |
| Denmark | $21.1 | 0.34% |
| Israel | $20.8 | 0.34% |
| Indonesia | $20.6 | 0.34% |
| Oman | $20.0 | 0.33% |
| Iraq | $19.4 | 0.32% |
| Peru | $12.5 | 0.20% |
| Vietnam | $12.3 | 0.20% |
| South Africa | $10.2 | 0.17% |
| All Other | $256.3 | 4.17% |
| Grand Total (Trillions) | $6,148.1 | 100.00% |
| SUMMARY BY TYPE OF DEBT HELD | ||
| Summary of Foreign Holders of USA Debt | Amount Held as of Dec 2015 (in Billions) | Percent |
| Treasury Bills | $336.7 | 5.48% |
| T-Bonds & Notes | $3,757.9 | 61.12% |
| Other | $2,053.5 | 33.40% |
| Grand Total (Trillions) | $6,148.1 | 100.00% |
Source:
Portfolio Holdings of U.S. and Foreign Securities
Visit USADebtClock.com to learn more!
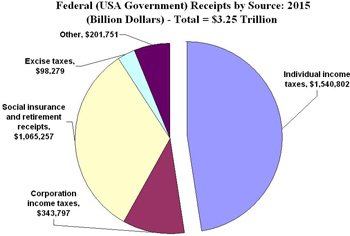
3 of 7. Present-Day USA Public (Government) Sector Operations: Fiscal Year 2015 (October 1 to September 30) Federal Receipts
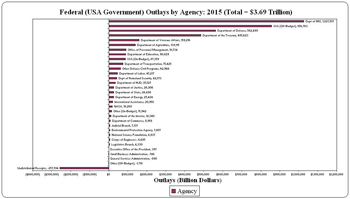
4 of 7. Present-Day USA Public (Government) Sector Operations: 2015 Federal Outlays
| Branch | 2013 (Number of Employees) | Percent |
|---|---|---|
| Legislative Branch | 28,672 | 1.05% |
| Judicial Branch | 33,776 | 1.24% |
| Executive Branch | 2,668,103 | 97.71% |
| Total USA Government Employment | 2,730,551 | 100.00% |
Source:
Employment and Trends - September 2013
5 of 7. Present-Day USA Private (Business) Sector Operations: 2010 Employment
| NAICS Code | NAICS Description | Number of Firms | Number of Establishments | Number Employed |
|---|---|---|---|---|
| 11 | Agriculture, Forestry, Fishing and Hunting | 21,407 | 22,111 | 154,496 |
| 21 | Mining, Quarrying, and Oil and Gas Extraction | 21,973 | 28,720 | 732,186 |
| 22 | Utilities | 5,909 | 18,004 | 638,575 |
| 23 | Construction | 646,433 | 658,483 | 5,470,181 |
| 31-33 | Manufacturing | 251,857 | 292,094 | 11,276,438 |
| 42 | Wholesale Trade | 312,540 | 419,648 | 5,908,763 |
| 44-45 | Retail Trade | 651,968 | 1,063,616 | 15,023,362 |
| 48-49 | Transportation and Warehousing | 169,741 | 215,547 | 4,287,236 |
| 51 | Information | 71,920 | 135,627 | 3,266,084 |
| 52 | Finance and Insurance | 234,839 | 472,242 | 6,063,761 |
| 53 | Real Estate and Rental and Leasing | 276,497 | 357,533 | 1,972,105 |
| 54 | Professional, Scientific, and Technical Services | 781,291 | 869,445 | 8,275,350 |
| 55 | Management of Companies and Enterprises | 26,667 | 52,909 | 3,098,762 |
| 56 | Administrative and Support and Waste Management and Remediation Services | 329,221 | 393,354 | 10,185,297 |
| 61 | Educational Services | 86,483 | 98,104 | 3,513,469 |
| 62 | Health Care and Social Assistance | 646,773 | 843,603 | 18,598,711 |
| 71 | Arts, Entertainment, and Recreation | 116,955 | 126,952 | 2,112,000 |
| 72 | Accommodation and Food Services | 504,228 | 673,810 | 12,395,387 |
| 81 | Other Services (except Public Administration) | 671,816 | 734,406 | 5,282,688 |
| 99 | Industries not classified | 12,145 | 12,145 | 0 |
| Total | 5,840,663 | 7,488,353 | 118,254,851 |
Source:
Statistics of U.S. Businesses
Number of Firms, Number of Establishments, Employment, and Annual Payroll by Enterprise Employment Size for the United States, All Industries: 2013
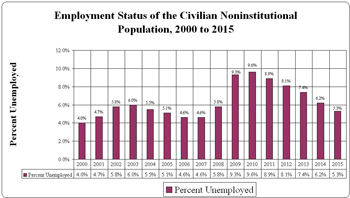
6 of 7. Present-Day USA Private (Business) Sector Operations: Unemployment Trends
| Year | Total Employed | Total Unemployed | Percent Unemployed |
|---|---|---|---|
| 2000 | 136,891,000 | 5,692,000 | 4.0% |
| 2001 | 136,933,000 | 6,801,000 | 4.7% |
| 2002 | 136,485,000 | 8,378,000 | 5.8% |
| 2003 | 137,736,000 | 8,774,000 | 6.0% |
| 2004 | 139,252,000 | 8,149,000 | 5.5% |
| 2005 | 141,730,000 | 7,591,000 | 5.1% |
| 2006 | 144,427,000 | 7,001,000 | 4.6% |
| 2007 | 146,047,000 | 7,078,000 | 4.6% |
| 2008 | 145,362,000 | 8,924,000 | 5.8% |
| 2009 | 139,877,000 | 14,265,000 | 9.3% |
| 2010 | 139,064,000 | 14,825,000 | 9.6% |
| 2011 | 139,869,000 | 13,747,000 | 8.9% |
| 2012 | 142,469,000 | 12,506,000 | 8.1% |
| 2013 | 143,929,000 | 11,460,000 | 7.4% |
| 2014 | 146,305,000 | 9,617,000 | 6.2% |
| 2015 | 148,834,000 | 8,296,000 | 5.3% |
Source:
Employment Status of the Civilian Noninstitutional Population, 1945 to Date
See also:
Bureau of Labor Statistics Data: (Seasonally Adjusted) Unemployment Rate
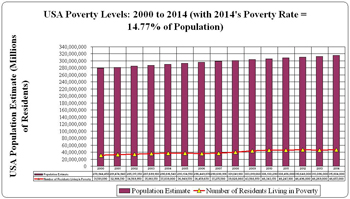
| Year | Population Estimate | Number of Residents Living in Poverty | Poverty Rate |
|---|---|---|---|
| 2000 | 278,944,450 | 31,581,090 | 11.32% |
| 2001 | 281,474,940 | 32,906,510 | 11.69% |
| 2002 | 285,317,350 | 34,569,950 | 12.12% |
| 2003 | 287,699,180 | 35,861,170 | 12.46% |
| 2004 | 290,616,540 | 37,039,800 | 12.75% |
| 2005 | 293,134,550 | 36,949,570 | 12.60% |
| 2006 | 296,449,870 | 36,459,670 | 12.30% |
| 2007 | 298,698,990 | 37,275,580 | 12.48% |
| 2008 | 301,041,180 | 39,828,860 | 13.23% |
| 2009 | 303,819,660 | 43,568,970 | 14.34% |
| 2010 | 306,130,290 | 46,343,170 | 15.14% |
| 2011 | 308,456,000 | 46,247,100 | 14.99% |
| 2012 | 310,648,000 | 46,496,000 | 14.97% |
| 2013 | 313,096,000 | 46,269,000 | 14.78% |
| 2014 | 315,804,000 | 46,657,000 | 14.77% |
Source:
Number in Poverty and Poverty Rate: 2010 to 2014
| Household Unit | Total Household Income Earned Per Year |
|---|---|
| One person household earning less than | $12,071 |
| Two-person household earning less than | $15,379 |
| Three-person household earning less than | $18,850 |
| Four-person household earning less than | $24,230 |
| Five-person household earning less than | $28,695 |
| Six-person household earning less than | $32,473 |
| Seven-person household earning less than | $36,927 |
| Eight-person household earning less than | $40,968 |
| Nine-person household earning less than | $49,021 |
Source:
Poverty Thresholds
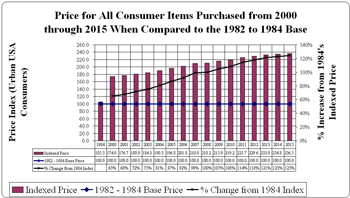
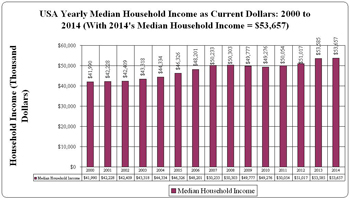
7 of 7. Present-Day USA Consumer Sector: Individual, Family, and Household Operations
Despite its present-day fiscal and budgetary challenges, despite its present-day challenges with substance abuse, despite its present-day challenges with political bickering, and despite its present-day challenges with gunplay, the USA remains a land of opportunity and freedom. The USA remains a place where Slumdog Millionaire kinds of dreams really do come true.
This page is titled "USA Welcome". I should qualify the title by stating that the "USA Welcome" phrase seems only to apply to legal visitors and legal immigrants. The USA does not appear to be quite as welcoming of the downtrodden who enter the country illegally. For some USA residents, the words "Give me your tired, your poor, Your huddled masses yearning to breathe free, The wretched refuse of your teeming shore. Send these, the homeless, tempest-tossed to me, I lift my lamp beside the golden door!" (Emma Lazarus) seem not to apply to illegal immigrants.
- USA Right Now - Live statistics on the USA
- Inside America's Economic Machine
- 2010 USA Population Details
- Historical Statistics
- Careers in Politics
- Careers in the Federal Government
- Federal Budget 101 - National Priorities Project
- Eliminating the Federal Debt - Plan 1
- Eliminating the Federal Debt - Plan 2
- Eliminating the Federal Debt - Plans 3, 4, 5, 6, 7, and 8
- Eliminating the Federal Debt - Plan 9
- USA Debt Clock
- USA Consumer Income Trends
- USA Consumer Expenditure Trends
- USA Consumer and Nonprofit Organization Balance Sheet Trends
- It's Your Money! Personal Finance, Debt, and Budgeting Steps and Spreadsheets
- US Census: 1940 vs. 2010 (Infographic) | US Diversity & Population Changes | LiveScience
- Economagic: Economic Time Series Page
- VisualCalc.com's Public Dashboards - Providing Insight Into Today's Biggest Issues
- Drug & Alcohol Abuse: Why Do People Use Drugs and Alcohol?
- Drug Abuse...The American Disease
- Causes, Treatment & Prevention of Drug Abuse
- Adherence to Healthy Lifestyle Habits in US Adults, 1988-2006
- Don't Fall into These Bad Habits
- Why Do Young People Murder?
- Youth Violence in Schools
- 2010's Indicators of School Crime and Safety
- How to Eliminate Bad Habits
- Welcome to the United States!
AMERICA'S FUTURE
- Science, Technology, Engineering, and Mathematics (STEM) Occupations: High-tech Jobs for a High-tech Economy
- Going Green: Environmental Jobs for Scientists and Engineers
- Projections of Education Statistics to 2030
- Career Guide to Industries Index
- Occupational Outlook Handbook Index
- College Navigator - National Center for Education Statistics
A LITTLE BIT OF USA-STYLE FUTURISTIC FUN...
The Black Eyed Peas - "Boom Boom Pow"Ready For The World - "Digital Display"
LMFAO - "La La La"
Beyonce - "Sweet Dreams"
Far East Movement - "Rocketeer"
Christina Aguilera - "Bionic"
Usher - "OMG"
will.i.am featuring Justin Bieber - "#thatPOWER"
Selena Gomez - "Come & Get It"
Missy Elliott & Da Brat - "Sock It 2 Me"
DEV - "In The Dark"
Black Eyed Peas - "Imma Be Rocking That Body"
...WHILE NOT FORGETTING ANCIENT HUMAN HISTORY...
...NOR FORGETTING HUMAN CONNECTIONS TO THE ANIMAL WORLD AND THE CYCLE OF LIFE ON EARTH...
...NOR FORGETTING HUMAN CONNECTIONS TO THE PLANT KINGDOM...
...AS HUMANS STRIVE TO "BREAKAWAY" AND ACHIEVE A "HIGHER GROUND" OF EXISTENCE AND CONSCIOUSNESS
- USA Census Bureau's Media Gallery
- The Executive Branch
- The Legislative Branch
- The Judicial Branch
- whitehouse.gov Photo Gallery
- Steve Petteway, Collection of the Supreme Court of the United States
Note: With the second Trump Presidency commencing on 20-January-2025, "USA Welcome" suddenly has begun to feel like "USA Unwelcome".
FLATTER THIS SITE:

SEARCH THIS SITE:
Intellectual Property Disclosures: All videos and songs (as well as many of the images) referenced or spotlighted throughout this website are the legal and intellectual properties of others. All content and opinions on this website (bruessard.com) are those of the author (Edward Bruessard) exclusively and do not necessarily reflect the opinions of the contributors, creators, owners, and distributors of these referenced videos, songs, and images. The author holds no legal interest or financial stake in any of these referenced videos, songs, and images. The contributors, creators, owners, and distributors of these referenced videos, songs, and images played no role at all regarding the appearance of said videos, songs, and images throughout this website; they had no clue that this website would be spotlighting their works.


