The afterlife reduces to nothing more than human speculation and conjecture. The life that you are living right now is real. Therefore, it would behoove you to make the most of this one chance at life on Earth that you know is real. It would behoove you to make the most of the here and now because the afterlife is not guaranteed. A peculiar thing about life is that there are no guarantees. One day you can be among the living, and the next day you can be among the deceased. Where does it leave you? It leaves you to make the most of the one life you know that you have right now.
The "Good Life," "Prosperity for All," and "More Money" pages of this website examined various ways to attain prosperity in life. The "Food for All" page of this website stressed the importance of adequate food for all humans in sustaining life. This page examines several ways to attain longevity in life. What are some of the drivers of good health and a long life? There is general consensus by experts in the medical field of study that a good diet and regular exercise are two of the most important components of living a long, healthy, and high quality of life.

Tag Cloud Image Credit representing World Bank's 2013 data of life expectancy at birth: Wordle
NOTE: The bigger the text size in the above image means the longer is a country's life expectancy rate.
The book The Age of Homo Sapiens Sapiens: Heaven or Hell is about human survival and the preservation of life on Earth. One way to preserve life is to examine the causes of death. The opposite of life is death. To understand the secret of life or to avoid death, a good starting point would be to examine some of the causes of death. If you are careful to avoid some of these leading causes of death, then the likelihood increases of you living a long and healthy life.
The table below lists the 15 leading causes of death in the USA during the year 2013.
15 Leading Causes of Death in the USA (Year 2013)
| Count |
15 Leading Causes of Death in the USA (Year 2013) |
Deaths |
Percent of All Deaths |
Cumulative Deaths |
Population |
Crude Rate Per 100,000 |
| 1 |
Heart diseases |
611,105 |
24% |
611,105 |
|
193.3 |
| 2 |
Cancer |
584,881 |
23% |
1,195,986 |
|
185.0 |
| 3 |
Chronic lower respiratory diseases |
149,205 |
6% |
1,345,191 |
|
47.2 |
| 4 |
Accidents (unintentional injuries) |
130,557 |
5% |
1,475,748 |
|
41.3 |
| 5 |
Stroke (cerebrovascular diseases) |
128,978 |
5% |
1,604,726 |
|
40.8 |
| 6 |
Alzheimer's disease |
84,767 |
3% |
1,689,493 |
|
26.8 |
| 7 |
Diabetes |
75,578 |
3% |
1,765,071 |
|
23.9 |
| 8 |
Influenza and pneumonia |
56,979 |
2% |
1,822,050 |
|
18.0 |
| 9 |
Kidney diseases (nephritis, nephrotic syndrome and nephrosis) |
47,112 |
2% |
1,869,162 |
|
14.9 |
| 10 |
Intentional self-harm (suicide) |
41,149 |
2% |
1,910,311 |
|
13.0 |
| 11 |
Blood poisoning (septicemia) |
38,156 |
1% |
1,948,467 |
|
12.1 |
| 12 |
Chronic liver disease and cirrhosis |
36,427 |
1% |
1,984,894 |
|
11.5 |
| 13 |
Hypertension and hypertensive renal disease |
30,770 |
1% |
2,015,664 |
|
9.7 |
| 14 |
Parkinson's disease |
25,196 |
1% |
2,040,860 |
|
8.0 |
| 15 |
Chronic inflammation of lung tissue (pneumonitis) due to solids and liquids |
18,579 |
1% |
2,059,439 |
|
5.9 |
| 16 |
All other causes of death |
537,554 |
21% |
2,596,993 |
|
170.0 |
| TOTAL |
|
2,596,993 |
100% |
|
316,128,839 |
821.5 |
DATA SOURCE: Centers for Disease Control and Prevention, National Center for Health Statistics. Underlying Cause of Death 1999-2013 on CDC WONDER Online Database, released 2015. Data are from the Multiple Cause of Death Files, 1999-2013, as compiled from data provided by the 57 vital statistics jurisdictions through the Vital Statistics Cooperative Program. Accessed at http://wonder.cdc.gov/ucd-icd10.html
See Also: http://www.cdc.gov/nchs/data/nvsr/nvsr64/nvsr64_02.pdf |
The top three causes of death in the USA during the year 2013 were heart disease (or 24% of all deaths), cancer (or 23% of all deaths), and chronic lower respiratory diseases (or 6% of all deaths). These three leading causes of death accounted for a combined total of 1,345,191 deaths or a little over half of the recorded 2,596,993 deaths in the USA during the year 2013. It has been firmly established by experts in the field of medicine that poor eating habits and poor exercise habits are major contributing factors to these three leading causes of death.
NUTRTION FOR ALL
How do you maintain a healthy and vigorous life span? One key to a healthy and vigorous life span is good nutrition. Without getting bogged down trying to memorize a lot of different measurements, a starting point for attaining good nutrition would be to adhere to the eating recommendations as outlined in the myplate graphic. For, as the saying goes, you are what you eat.

Photo Credit: Dietary Guidelines for Americans | Health.gov (ODPHP)
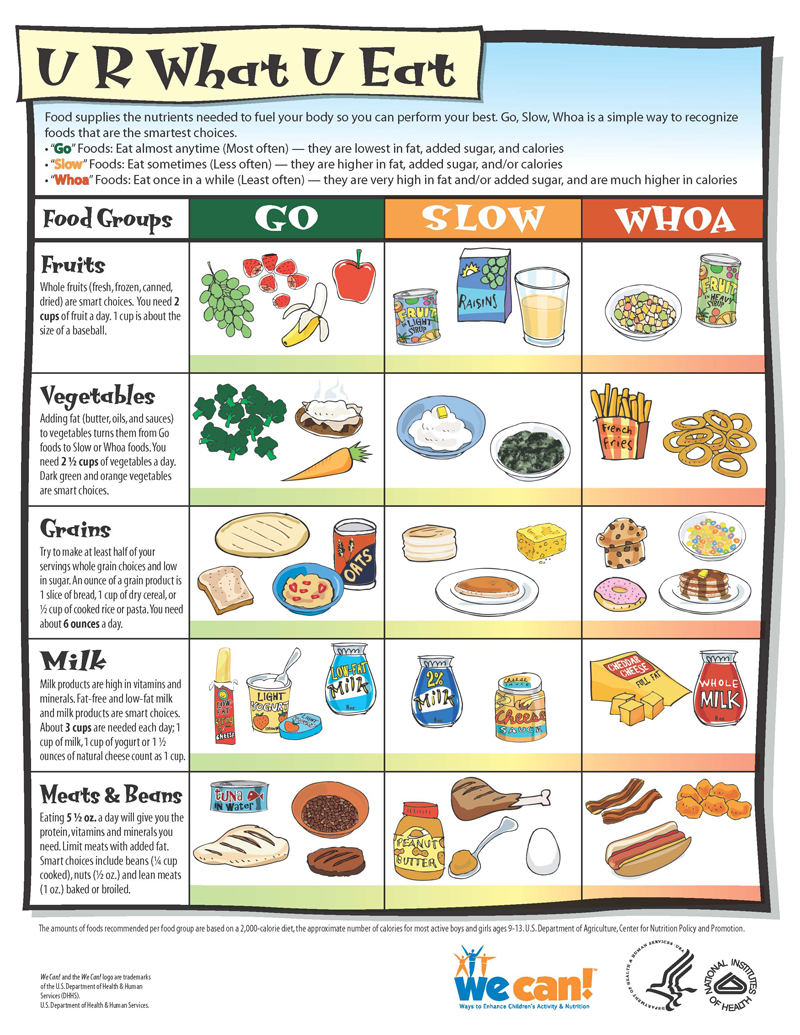

Photo Credit: U R What U Eat

Photo Credit: ChooseMyPlate.gov

Photo Credit: My Daily Food Plan
Watch (Introducing the New Food Icon: MyPlate )
Watch (How to Follow the USDA MyPlate Dietary Guidelines)
Watch (Dietary Guidelines)
When discussing food and nutrition, it is easy to get tripped up by terminology such as diet, calories, nutrients, digestion, metabolism, and so forth. An easy way of examining food, eating, and nutrition is this: Generally speaking, the human body needs to consume a minimum of 2,000 units of food (calories) a day for it to function normally. These 2,000 units of food are further subdivided into six main food groups:
Watch (Nutrition for a Healthy Life)
- Milk, yogurt, and cheese group
- Meat, poultry, fish, dry beans, eggs, and nuts group
- Vegetable group
- Fruit group
- Bread, cereal, rice, and pasta group
- Fats, oils, sugar, and salt group
Here are some very general definitions of some common terms related to food and nutrition:
- Diet:
- Your diet consists of the foods that you choose to eat each day.
- Calories:
- Calories are the units of energy that you derive from eating various food items.
- Nutrients:
- There are six general types of nutrients found in food items, and these nutrients are what calories are composed of (to varying degrees). The six types of nutrients are:
- Carbohydrates
- Fats (lipids)
- Protein
- Vitamins
- Minerals
- Water
- It is the nutrients found in food that supply the body with the energy it needs to function both at the microscopic cellular level and also at the macroscopic physiological level. These six nutrients are further grouped into macronutrients (for example, carbohydrates and protein) and micronutrients (for example, vitamins and minerals). The human body requires small amounts of the micronutrients and larger amounts of the macronutrients. The Daily Values (DV) table below expands upon this list of important nutrients, which is not a comprehensive list of nutrients.
- Digestion:
- The process in which the body (stomach) breaks down food
- Metabolism:
- The process in which the cell breaks down nutrients
- Nutrition:
- Nutrition is a derivative of the word nourish, and it broadly can be taken to mean nourishment for the body that's supplied in food
A common way to depict the nutrient value of a food item is to state nutrients as per 100 grams of an edible portion of food. The general rule of thumb is that, on average, the typical human should endeavor to consume about 2,000 calories of food per day. The following Daily Values table lists recommended daily nutrient intake values for a diet consisting of 2,000 calories.
Daily Values (DVs) FOR APPROPRIATE NUTRIENTS BASED ON A CALORIC INTAKE OF 2,000 CALORIES
| Nutrient Count |
Food Component |
Daily Value (DV) |
| 1 |
Total Fat |
65 g (grams) |
| 2 |
Saturated Fat |
20 g |
| 3 |
Cholesterol |
300 mg (milligrams) |
| 4 |
Sodium |
2,400 mg |
| 5 |
Potassium |
3,500 mg |
| 6 |
Total Carbohydrate |
300 g |
| 7 |
Dietary Fiber |
25 g |
| 8 |
Protein |
50 g |
| 9 |
Vitamin A |
5,000 IU (International Units) |
| 10 |
Vitamin C |
60 mg |
| 11 |
Calcium |
1,000 mg |
| 12 |
Iron |
18 mg |
| 13 |
Vitamin D |
400 IU |
| 14 |
Vitamin E |
30 IU |
| 15 |
Vitamin K |
80 ug (micrograms) |
| 16 |
Thiamin |
1.5 mg |
| 17 |
Riboflavin |
1.7 mg |
| 18 |
Niacin |
20 mg |
| 19 |
Vitamin B6 |
2 mg |
| 20 |
Folate |
400 ug |
| 21 |
Vitamin B12 |
6 ug |
| 22 |
Biotin |
300 ug |
| 23 |
Pantothenic acid |
10 mg |
| 24 |
Phosphorus |
1,000 mg |
| 25 |
Iodine |
150 ug |
| 26 |
Magnesium |
400 mg |
| 27 |
Zinc |
15 mg |
| 28 |
Selenium |
70 ug |
| 29 |
Copper |
2 mg |
| 30 |
Manganese |
2 mg |
| 31 |
Chromium |
120 ug |
| 32 |
Molybdenum |
75 ug |
| 33 |
Chloride |
3,400 mg |
| DATA SOURCE: Guidance for Industry: A Food Labeling Guide |
See Also: Metric/English Conversion Factors
TROUBLE IN PARADISE
A nutritious diet is one in which your body takes in the maximum number of good calories and the minimum number of bad calories while eating. The so-called bad foods add little to your good health and longevity because they are low in nutrients.
Here's the problem with food and eating. Many humans take in a lot of calories when eating various food items, but they do not necessarily obtain the minimum number of nutrients desired from the food items that they are eating. There are several ways to go about consuming those 2,000 calories each day. There is the so-called good way to go about obtaining those 2,000 calories each day, and there is the so-called bad way. The following table illustrates the good versus bad approaches.

Photo Credit: We Can! GO, SLOW, and WHOA Foods
It turns out that not all food items are created equal. Some food items are low in calories but high in nutrients. Other food items are high in calories but low in nutrients. Food items that contain lots of added fats, sugar, and salt are the ones that are high in calories but low in nutrients.
HOW DO I COUNT EMPTY CALORIES?
| 1. DAIRY GROUP |
| Food |
Amount |
Estimated Total Calories |
Estimated Empty Calories (calories from solid fats and added sugars) |
Net Gain from Eating |
| Fat-free milk (skim) |
1 cup |
83 |
0 |
83 |
| 1% milk (low fat) |
1 cup |
102 |
18 |
84 |
| 2% milk (reduced fat) |
1 cup |
122 |
37 |
85 |
| Whole milk |
1 cup |
149 |
63 |
86 |
| Low-fat chocolate milk |
1 cup |
158 |
64 |
94 |
| Cheddar cheese |
1 ½ ounces |
172 |
113 |
59 |
| Nonfat mozzarella cheese |
1 ½ ounces |
59 |
0 |
59 |
| Whole milk mozzarella cheese |
1 ½ ounces |
128 |
76 |
52 |
| Fruit flavored low-fat yogurt |
1 cup (8 fl oz.) |
250 |
152 |
98 |
| Frozen yogurt |
1 cup |
224 |
119 |
105 |
| Ice cream, vanilla |
1 cup |
275 |
210 |
65 |
| Cheese sauce |
¼ cup |
120 |
64 |
56 |
| Subtotal |
|
1842 |
916 |
926 |
| |
| 2. PROTEIN FOODS GROUP |
| Food |
Amount |
Estimated Total Calories |
Estimated Empty Calories (calories from solid fats and added sugars) |
Net Gain from Eating |
| Extra lean ground beef, 95% lean |
3 oz., cooked |
146 |
0 |
146 |
| Regular ground beef, 80% lean |
3 oz., cooked |
229 |
64 |
165 |
| Turkey roll, light meat |
3 slices (1 oz. each) |
165 |
0 |
165 |
| Roasted chicken breast (skinless) |
3 oz., cooked |
138 |
0 |
138 |
| Roasted chicken thigh with skin |
3 oz., cooked |
209 |
47 |
162 |
| Fried chicken with skin & batter |
3 medium wings |
478 |
382 |
96 |
| Beef sausage, pre-cooked |
3 oz., cooked |
345 |
172 |
173 |
| Pork sausage |
2 patties (2 oz.) |
204 |
96 |
108 |
| Beef bologna |
3 slices (1 oz. each) |
261 |
150 |
111 |
| Subtotal |
|
2175 |
911 |
1264 |
| |
| 3. GRAINS GROUP |
| Food |
Amount |
Estimated Total Calories |
Estimated Empty Calories (calories from solid fats and added sugars) |
Net Gain from Eating |
| Whole wheat bread |
1 slice (1 oz.) |
69 |
0 |
69 |
| White bread |
1 slice (1 oz.) |
69 |
0 |
69 |
| English muffin |
1 muffin |
132 |
0 |
132 |
| Blueberry muffin |
1 small muffin (2 oz.) |
259 |
69 |
190 |
| Croissant |
1 medium (2 oz.) |
231 |
111 |
120 |
| Biscuit, plain |
1 medium (2.5" diameter) |
186 |
71 |
115 |
| Cornbread |
1 piece (2 ½" x 2 ½" x 1 ¼") |
167 |
52 |
115 |
| Corn flakes cereal |
1 cup |
90 |
8 |
82 |
| Frosted corn flakes cereal |
1 cup |
147 |
56 |
91 |
| Graham crackers |
2 large pieces |
118 |
54 |
64 |
| Whole wheat crackers |
5 crackers |
85 |
25 |
60 |
| Round snack crackers |
7 crackers |
106 |
42 |
64 |
| Chocolate chip cookies |
2 large |
161 |
109 |
52 |
| Chocolate cake |
1 slice of two-layer cake |
408 |
315 |
93 |
| Glazed doughnut, yeast type |
1 medium, 3 ¾" diameter |
255 |
170 |
85 |
| Cinnamon sweet roll |
1 medium roll |
223 |
137 |
86 |
| Subtotal |
|
2706 |
1219 |
1487 |
| |
| 4. VEGETABLE GROUP |
| Food |
Amount |
Estimated Total Calories |
Estimated Empty Calories (calories from solid fats and added sugars) |
Net Gain from Eating |
| Baked potato |
1 medium |
159 |
0 |
159 |
| French fries |
1 medium order |
431 |
185 |
246 |
| Onion rings |
1 order (8 to 9 rings) |
275 |
160 |
115 |
| Subtotal |
|
865 |
345 |
520 |
| |
| 5. FRUIT GROUP |
| Food |
Amount |
Estimated Total Calories |
Estimated Empty Calories (calories from solid fats and added sugars) |
Net Gain from Eating |
| Unsweetened applesauce |
1 cup |
105 |
0 |
105 |
| Sweetened applesauce |
1 cup |
173 |
68 |
105 |
| Subtotal |
|
278 |
68 |
210 |
| |
| 6. OTHER |
| Food |
Amount |
Estimated Total Calories |
Estimated Empty Calories (calories from solid fats and added sugars) |
Net Gain from Eating |
| Pepperoni pizza |
1 slice of a 14" pizza, regular crust |
340 |
139 |
201 |
| Regular soda |
1 can (12 fluid oz.) |
136 |
136 |
0 |
| Regular soda |
1 bottle (19.9 fluid oz.) |
192 |
192 |
0 |
| Fruit-flavored drink |
1 cup |
128 |
128 |
0 |
| Butter |
1 teaspoon |
36 |
33 |
3 |
| Stick margarine |
1 teaspoon |
36 |
32 |
4 |
| Cream cheese |
1 Tablespoon |
41 |
36 |
5 |
| Heavy (whipping) cream |
1 Tablespoon |
51 |
45 |
6 |
| Frozen whipped topping (non dairy) |
¼ cup |
60 |
55 |
5 |
| Table wine |
1 glass (5 fluid oz.) |
121 |
121* |
0 |
| Beer (regular) |
1 can ( 12 fluid oz.) |
155 |
155* |
0 |
| Beer (light) |
1 can (12 fluid oz.) |
104 |
104* |
0 |
| Distilled spirits (80 proof) |
1 standard drink (1 ½ fluid oz.) |
96 |
96* |
0 |
| Subtotal |
|
1496 |
1272 |
224 |
| |
| GRAND TOTAL |
|
9362 |
4731 |
4631 |
| * Calories from alcohol are not from solid fats or added sugars, but they count against your limit for empty calories -- calories from solid fats and added sugars. |
| DATA SOURCE: How Do I Count Empty Calories? |
If all of the food items in the above table were eaten by you over a given period of time, then the above table indicates that 4,731 (or 51%) of 9,362 total calories consumed would have been useless to your body in term of their nutrient value.
The following table shows the recommended daily limits or the recommended maximum intake of "empty" calories per day.
DAILY LIMIT FOR EMPTY CALORIES
| Age and gender |
Estimated calories for those who are not physically active |
| |
Total daily calorie needs* |
Daily limit for empty calories |
| Children 2-3 yrs |
1000 calories |
135** |
| Children 4-8 yrs |
1200-1400 calories |
120 |
| Girls 9-13 yrs |
1600 calories |
120 |
| Boys 9-13 yrs |
1800 calories |
160 |
| Girls 14-18 yrs |
1800 calories |
160 |
| Boys 14-18 yrs |
2200 calories |
265 |
| Females 19-30 yrs |
2000 calories |
260 |
| Males 19-30 yrs |
2400 calories |
330 |
| Females 31-50 yrs |
1800 calories |
160 |
| Males 31-50 yrs |
2200 calories |
265 |
| Females 51+ yrs |
1600 calories |
120 |
| Males 51+ yrs |
2000 calories |
260 |
| * These amounts are appropriate for individuals who get less than 30 minutes of moderate physical activity most days. Those who are more active need more total calories, and have a higher limit for empty calories. To find your personal total calorie needs |
| ** The limit for empty calories is higher for children 2 and 3 years old than it is for some older children, because younger children have lower nutrient needs and smaller recommended intakes from the basic food groups. |
| DATA SOURCE: How Many [Empty Calories] Can I Have?
|
You can look up various food items on the USA Department of Agriculture's Food-A-Pedia website. Food-A-Pedia allows you to determine the caloric values and nutrient contents of various food items.
The most important thing to remember about food, eating, and obtaining the minimum amount of nutrients is this: Your body should be getting all of the good nutrients it needs as long as you adhere to the USDA's MyPlate dietary guidelines by:
- eating a variety of foods each day from the five food groups
- drinking lots of water
- minimizing your intake of bad nutrients such as foods containing lots of salt, sugar, alcohol, saturated fat, and trans fat.
- exercising or staying physically active
Watch (Why Kids Should Eat Healthy and Exercise)


Photo Credit: Sample Menus for a 2000 Calorie Food Pattern
A MULTIMEDIA VIEW OF NUTRITION
When it comes to nutrition for all, the name of the game is to strike a harmonious balance between acquiring calories (that is, eating healthy) and burning calories (that is, exercising regularly). How well do you play the nutrition game each day? If you take in more calories than you burn, then you will tend to become overweight. If you burn more calories than you take in, then you will tend to become underweight. Your goal in life would be to maintain a normal weight.
The following bloc of videos provides a multimedia view of nutrition.
Watch (Basic Nutrition Module 1 - Getting started)
Watch (Basic Nutrition Module 2 - Good Tasting Food)
Watch (Basic Nutrition Module 3 - Understanding Nutrition Labels)
Watch (Basic Nutrition Module 4 - Get Skinny on Fats, Sugar and Sodium)
Watch (Basic Nutrition Module 5 - Making a Menu)
Watch (Bill Nye: The Science Guy & Nutrition)

PHYSICAL ACTIVITY MATTERS
Watch (Physical Activity Guidelines Getting Started)
What is a normal weight? One crude technique for determining a normal weight is called the body mass index (BMI). The BMI is a measure of body fat based on height and weight. You can get a hint of whether you are overweight, underweight, or of normal weight by computing your BMI. The following table lists the typical BMI ranges for adults. The important thing to remember about your BMI is this: Your health risks rise the greater your BMI falls outside the normal range.
The following table shows a BMI ranging from 18.5 to 24.9 as being a normal rating for the typical adult. You can use the BMI calculator immediately below to compute your BMI.

Photo Credit: Dietary Guidelines
When it comes to children and weight, the following table shows a BMI between the 5th and 85th percentile as normal for the typical child. You can use the BMI calculator immediately below to compute the BMI for children and teenagers.
BMI FOR CHILDREN AND TEENS
| Weight Status Category |
Percentile Range |
| Underweight |
Less than the 5th percentile |
| Healthy weight |
5th percentile to less than the 85th percentile |
| Overweight |
85th to less than the 95th percentile |
| Obese |
Equal to or greater than the 95th percentile |
| DATA SOURCE: About BMI for Children and Teens |

Photo Credit: Physical Activity Pyramid for Young Children

MENTAL HEALTH MATTERS, TOO
Although often overlooked, having good mental health is equally as important as good physical health. Good nutrition is a vital component of brain development. Character, too, is an important component of good mental health. Character building starts early at home with child rearing practices. Character building continues throughout life's socialization process such as at school, places of worship, work, and play. Building a strong moral compass at an early age facilitates the process of maintaining good mental health throughout life.


Watch (Strength Over Silence: Tackling Mental Health Stigma)

CLOSING THOUGHTS
The main thing to remember about food and nutrition is this: Food supplies your body with the energy that you need to stay healthy and to live long. It is your choice whether to supply your body with watered-down energy in the form of poor dietary practices or whether to supply it with robust energy in the form of good dietary practices. I realize that numerous factors are involved in the making of eating decisions. These factors include customs and culture, upbringing, socialization and peer pressure, marketing and mass media influences, affordability, availability, convenience, taste, aesthetics, and so forth. With the passage of time, humans tend to become creatures of habit. Humans tend to become set in their ways. If you have become accustomed to eating poorly, then it becomes all the more challenging for you to break those poor eating habits.
The following graphic illustrates that your body should be obtaining the minimum amount of nutrients it needs as long as you adhere to the following suggestions:

Photo Credit: Dietary Guidelines
Watch [(Jack Lalanne - 10 Point Plan (Tribute)]
Watch (Need of Good Nutrition)
It's been said that an ounce of prevention is worth more than a pound of cure. When it comes to good health and living a long life, I concur with this saying. Humans must become proactive in maintaining their good physical health. Humans must become proactive by eating nutritious and balanced meals. Humans must become physically active. The alternative is the reactive approach to health maintenance, which involves constantly taking lots of medicines and pills and constantly visiting the doctor to treat some physical ailment or another.
What is the moral to be gleaned from this examination of nutrition for all? The moral is this: Humans should not live by calories alone but should strive to eat food items that are fortified with the maximum number of nutrients. For, as the saying goes, your body is a temple (to a fulfilled life).
ADDITIONAL NUTRITION RESOURCES:
- SuperTracker Home
- National Nutrient Database for Standard Reference Release 27
- Nutrition and Your Health: Dietary Guidelines for Americans
- Super Foods
- Free Diet Plans at SparkPeople
- DietMaster 2100 v12
- The Food Processor Diet Analysis and Fitness Software
- CRON-O-Meter: Track Nutrition & Count Calories
- Life Expectancy or Longevity Calculator | Medindia
- FoodSafety.gov
- Lifespan Calculator – Test Your Life Expectancy || NM
- Medical Information & Trusted Health Advice: Healthline
- Shape Up America!
- HealthClubs.com
- American Heart Association
- American Psychiatric Association
- Precision Nutrition | Nutrition Certification, Coaching & Software
NOTE: Please view your browser's page source for a list of resources used to create this page (generally, by right clicking the mouse).